
When gold and silver stop moving together
Takeaway: gold and silver only move as a pair while one force drives both. When silver's industrial demand takes over, the link breaks, and owning both
By the Deriv desk · 17 August 2026 · 4 min read

Takeaway: gold and silver only move as a pair while one force drives both. When silver's industrial demand takes over, the link breaks, and owning both stops being real diversification.
Gold and silver usually rise and fall together. But right now they aren't and it shows how correlation actually works.
Their 30-day correlation has flipped negative. Both metals sit near record highs, yet on a short-term basis they are drifting apart. For anyone holding both as a diversified metals bet, that is the point worth understanding: a correlated pair can quietly become one wager, or split into two, depending on what is driving it.

Why gold and silver normally move together
Most of the time, both metals answer to the same forces. Safe-haven demand, the US dollar, and real yields push them the same way. When rate-cut hopes rise, capital flows into both. When fear spikes, both catch a bid.
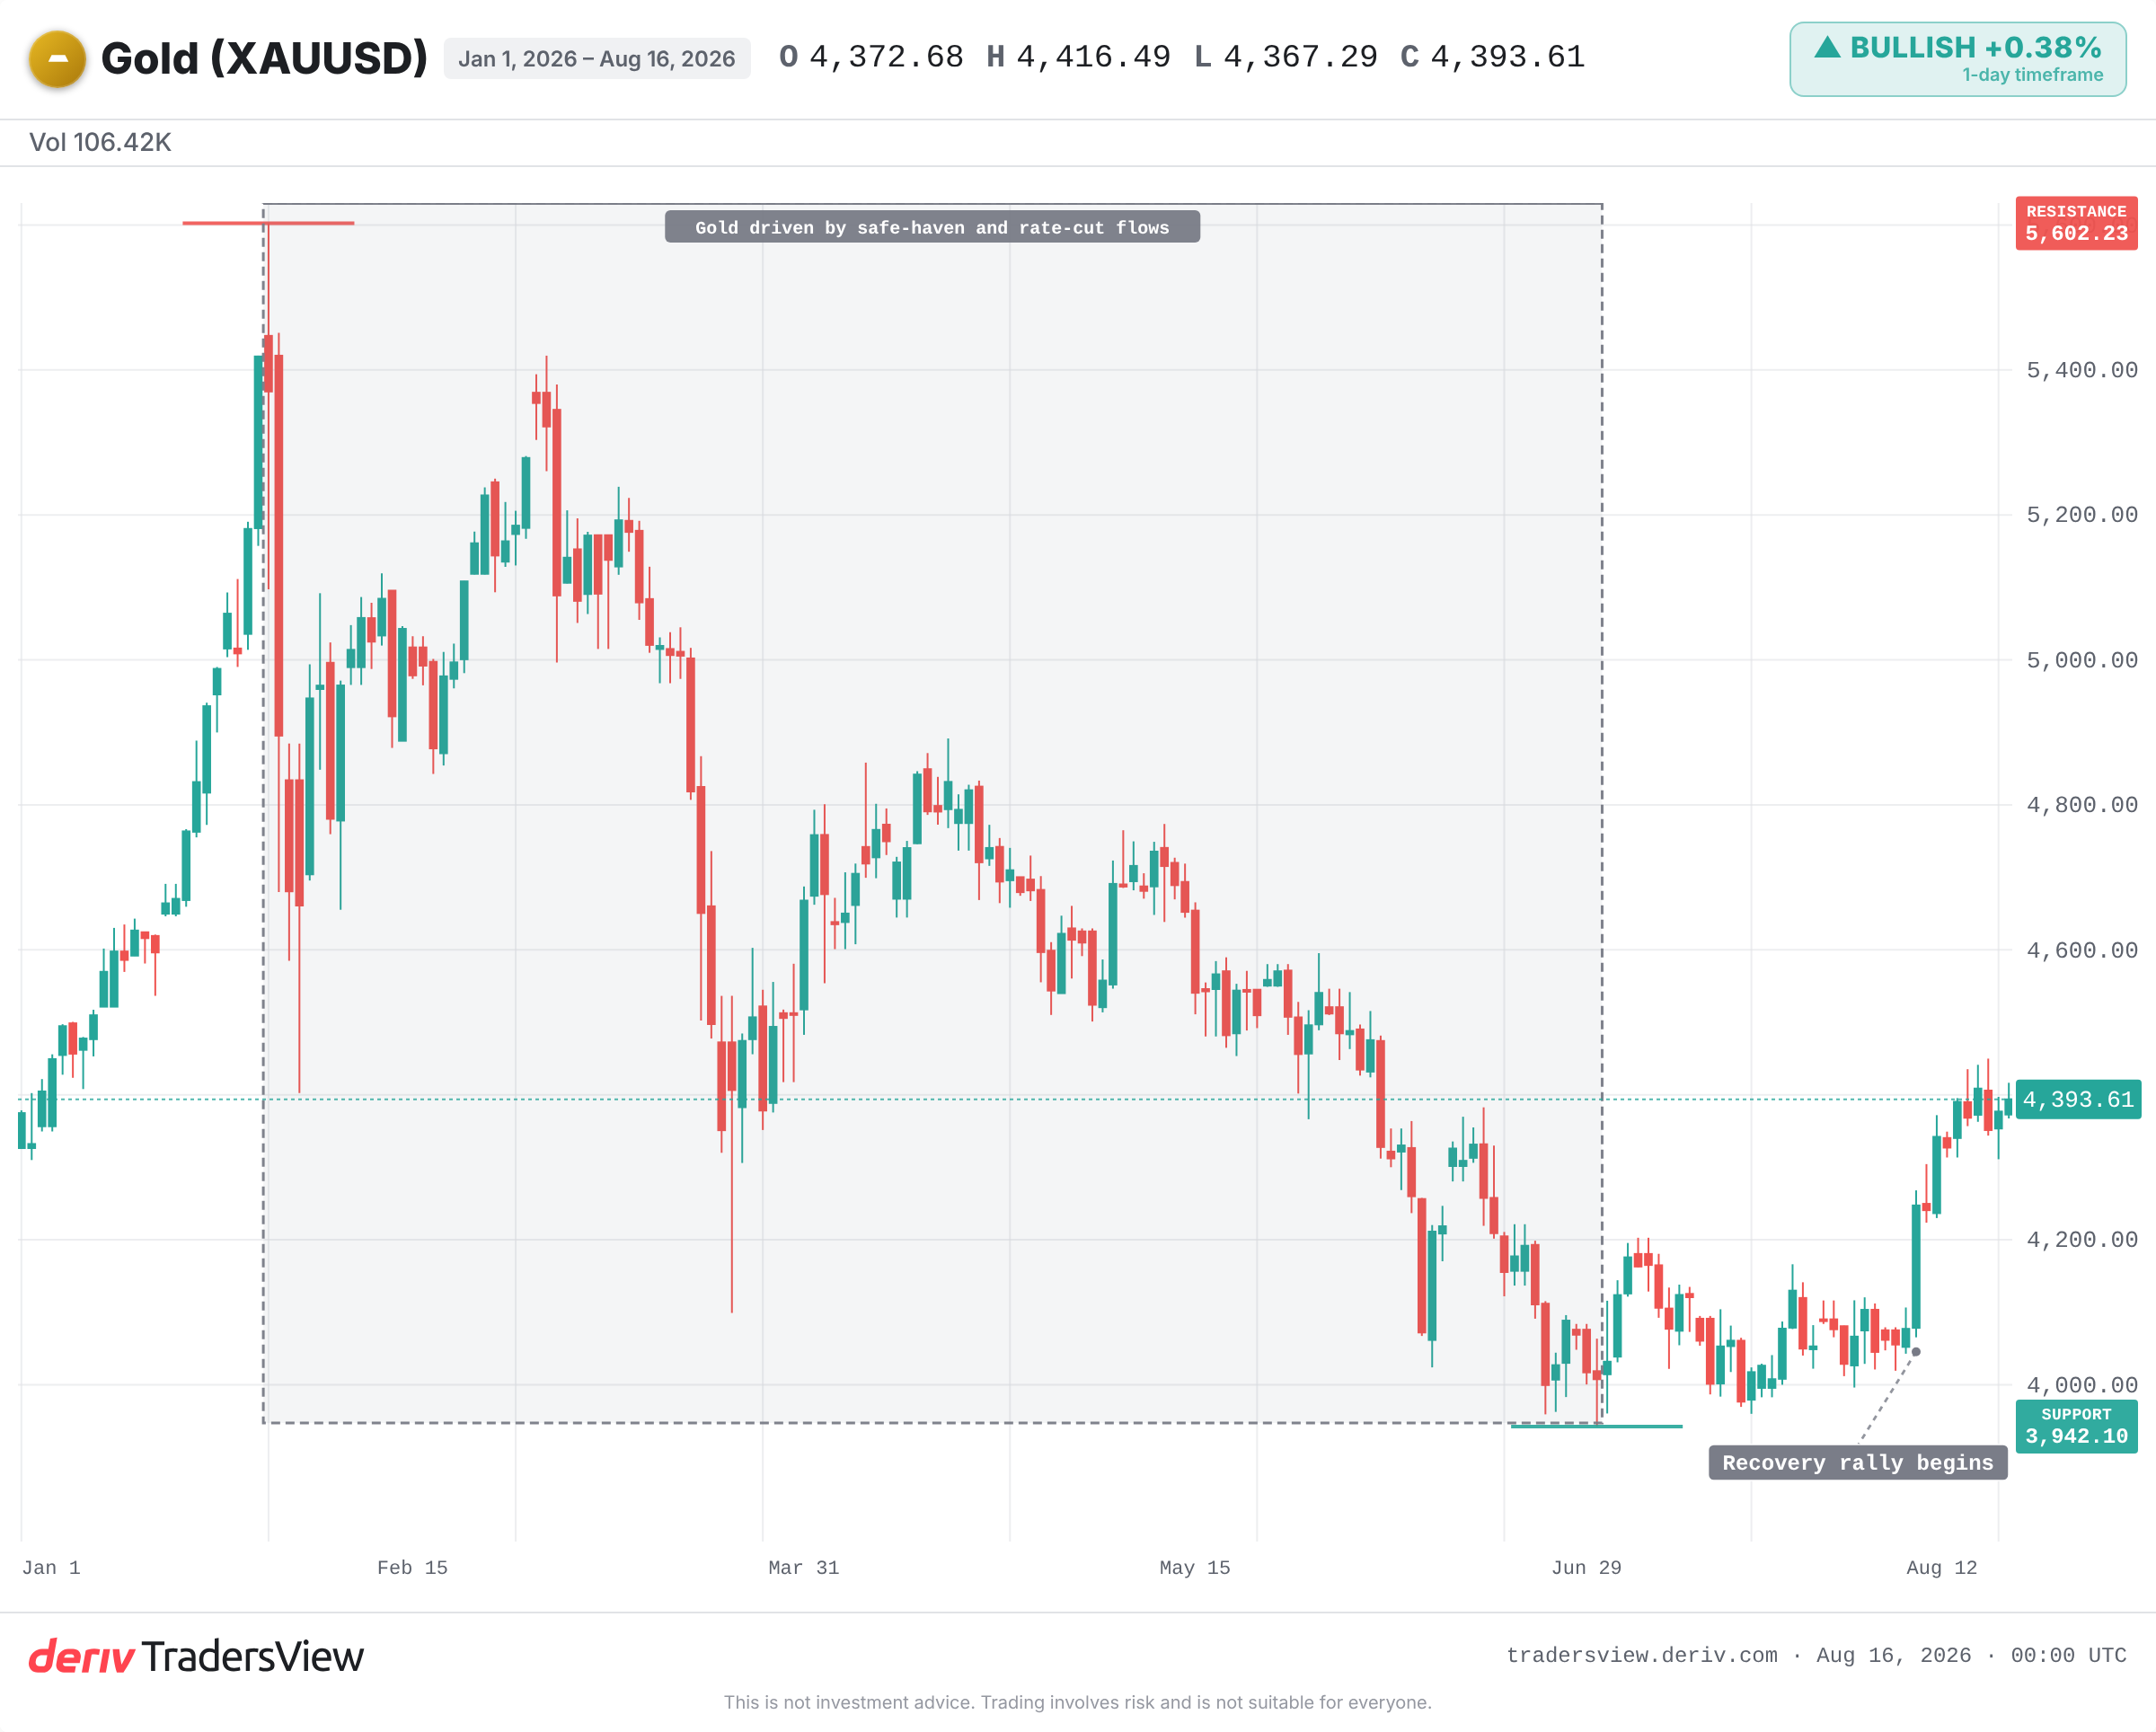
That shared driver is what creates the correlation. It is not a fixed property of the two assets. Correlation holds only while a common force dominates both. Break that condition and the link can loosen fast.
What made silver break ranks
Silver has a second job that gold does not. It is an industrial metal, used in solar panels, electronics, and electric vehicles. Gold is mostly a store of value.
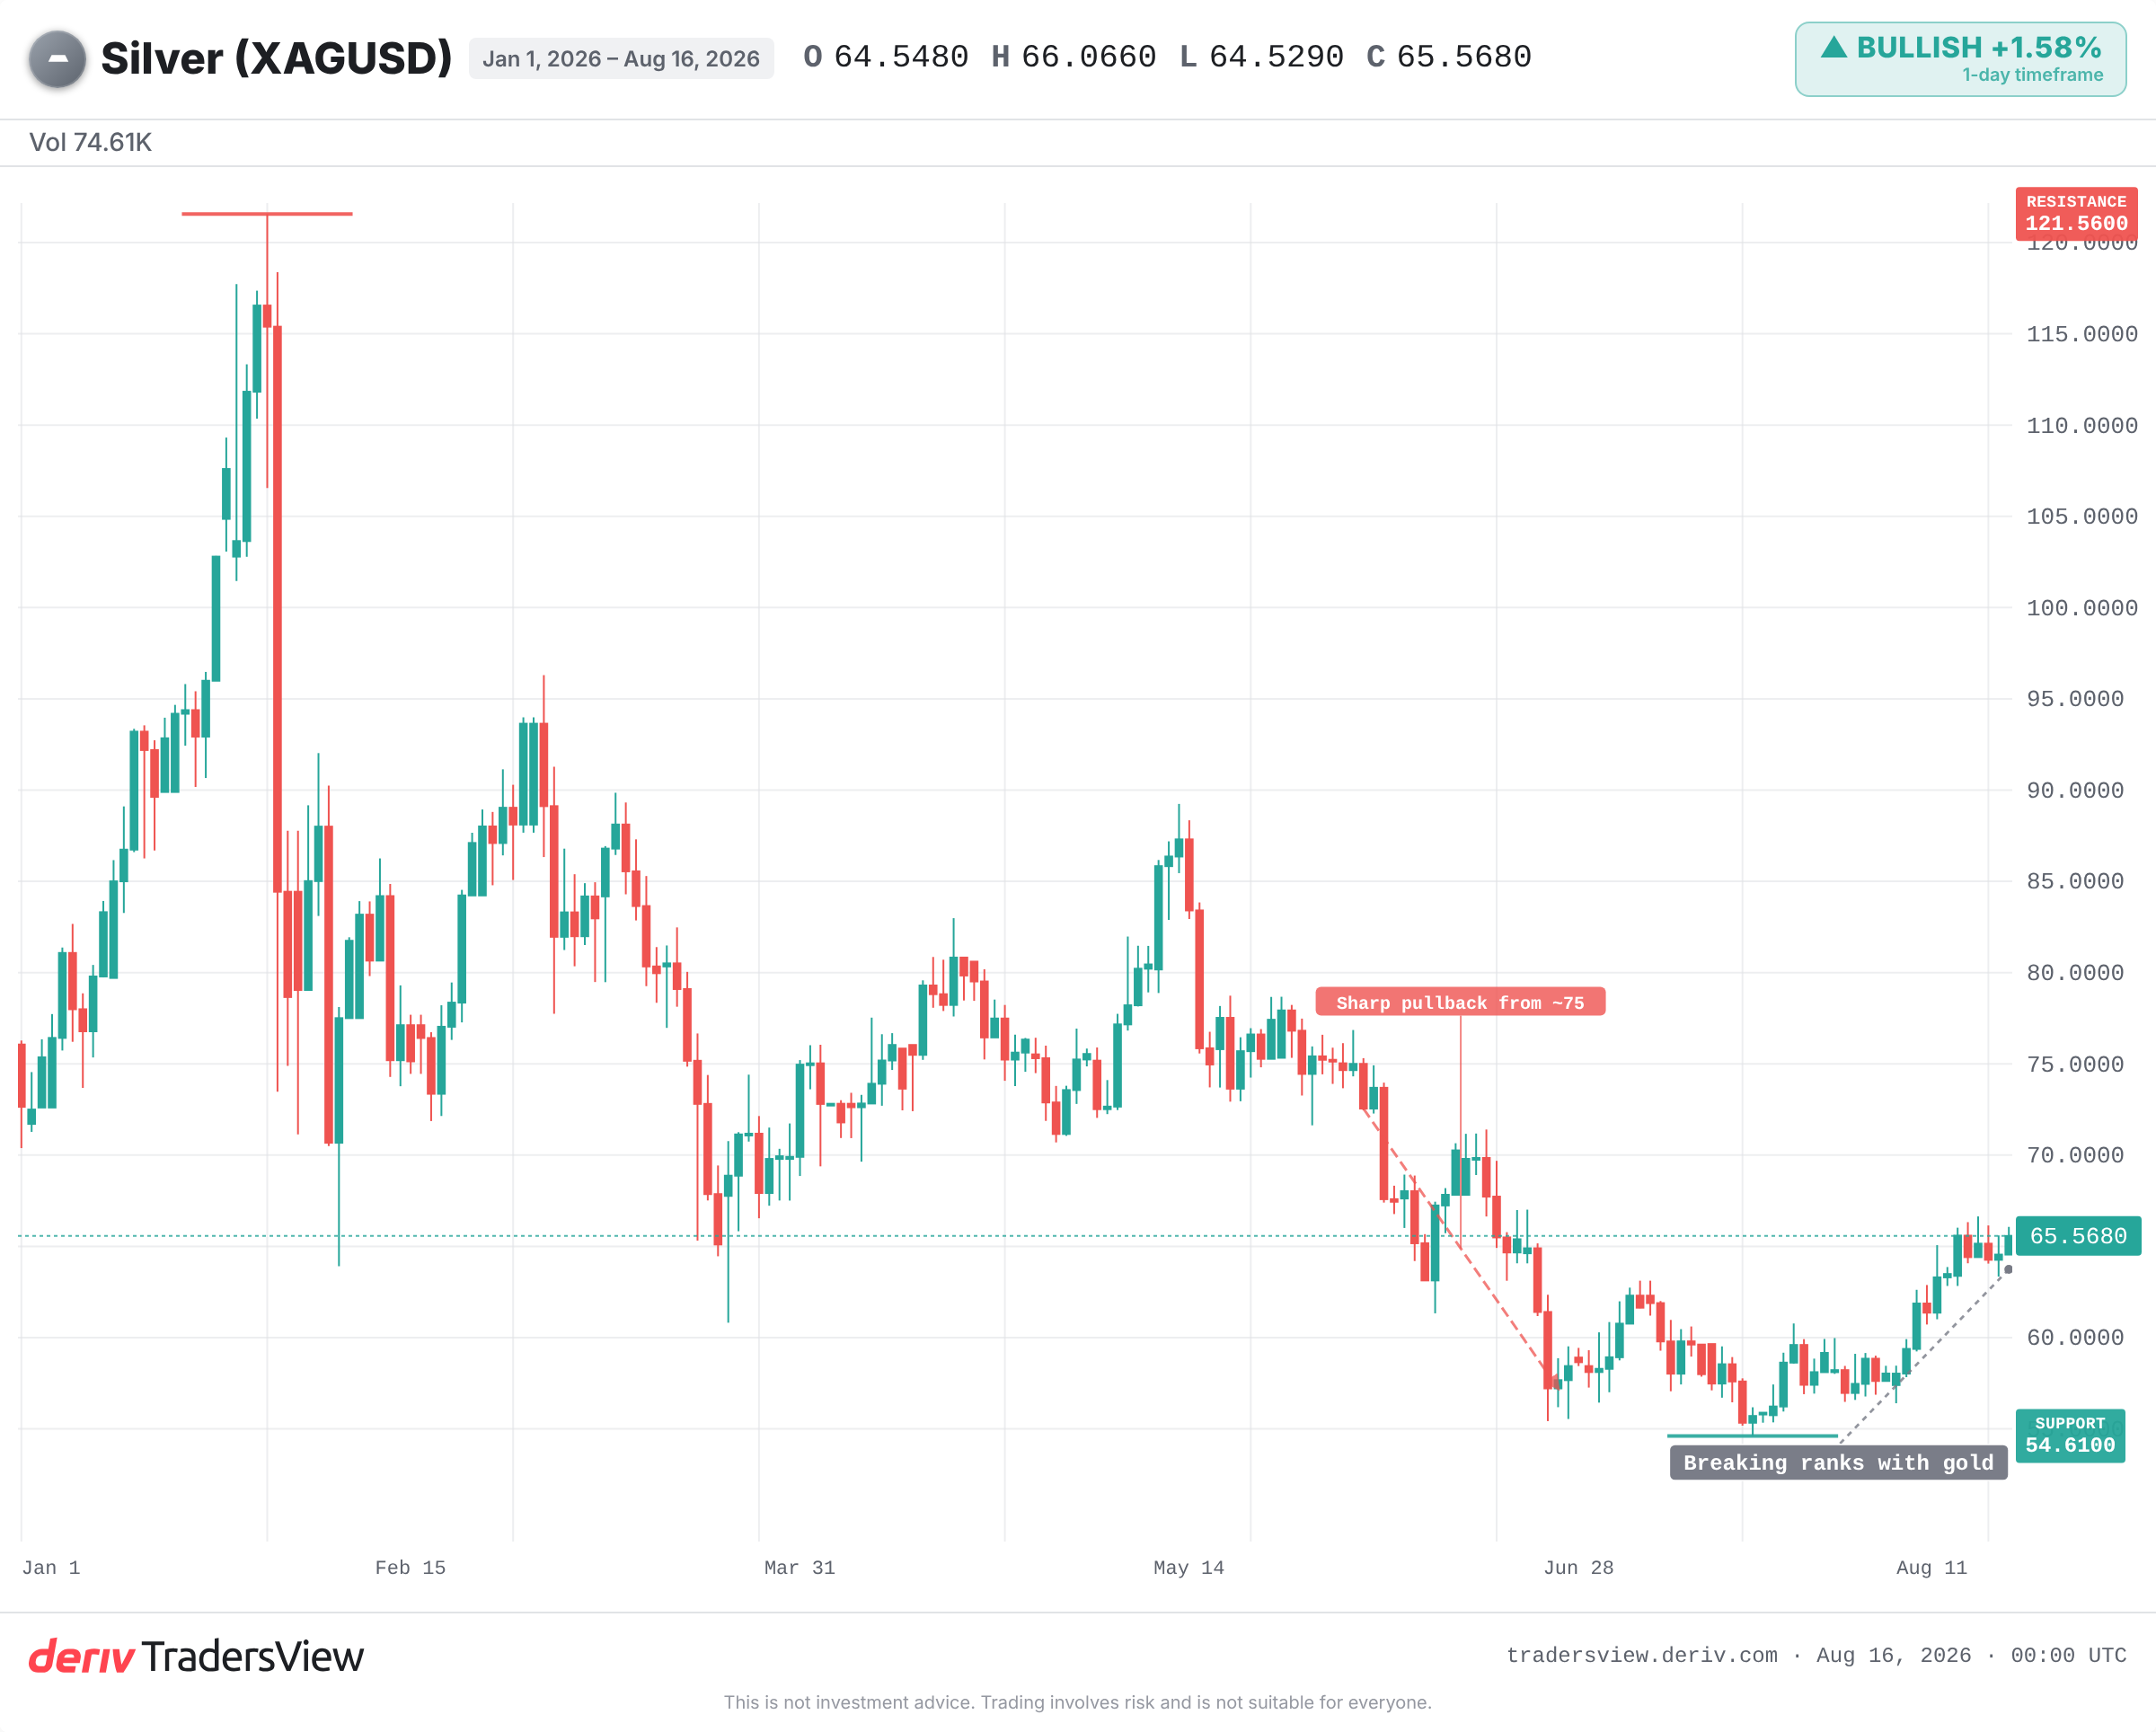
When silver's industrial demand story gets loud enough, it starts trading on its own driver. It stops shadowing gold and follows manufacturing and technology demand instead. That is the read behind the recent decoupling: gold on safe-haven and rate-cut flows, silver on its own supply-and-demand picture.
The clue is simple. Watch whether each metal responds to different news. If gold moves on jobs data and silver moves on factory demand, the split is real.
Is this a real regime change or just noise?
Here honesty matters. A 30-day correlation reading is a short window, and a mild negative figure can be noise rather than a structural break. Both metals are still near record highs. A single dollar move or a risk-off shock could re-sync them within days.
The decoupling thesis only earns its keep if the negative correlation persists over a longer 60 to 90 day window, and if silver keeps tracking industrial signals while gold trades on macro flows. Until then, treat the split as provisional.
Why the divergence rarely lasts
History leans towards reversion. In 2011, silver spiked towards $50 on speculative and industrial demand while gold climbed on haven flows. Then the pair diverged violently: silver collapsed roughly 30% within days while gold held up far longer.
In the March 2020 crunch, both metals fell together. Gold recovered first as a haven; silver lagged, then caught up on the recovery trade. The gold/silver ratio hit an extreme above 120 before compressing hard.
Extreme ratio readings have repeatedly preceded reversion. A decoupling tends to be a phase, not a permanent state.
What this means for treating the pair as diversification
The trap is assuming two correlated assets always cushion each other. When they share a driver, owning both is close to one bet doubled, not two bets spread. When they split, the diversification returns, but so does silver's much higher volatility.
Silver's typical daily move relative to its price is far larger than gold's. A metal you held to dampen swings can amplify them instead.
What to watch: whether the negative correlation survives a longer window, the US dollar and rate-cut expectations that pull both metals together, industrial demand signals for silver, and the gold/silver ratio nearing a historical extreme. The correlation is a lease, not a deed. Know which driver is paying the rent.
Frequently asked questions
It is the number of ounces of silver it takes to buy one ounce of gold. It widens when investors favour safe havens and narrows during industrial booms. Extreme readings have often preceded a reversal back towards the long-run average.
Yes. Silver's typical daily move relative to its price is far larger than gold's, partly because its smaller market and industrial exposure amplify swings. A metal held to reduce risk can add to it instead.
A 30-day reading can be noise. To judge a genuine shift, look at whether the relationship holds over a longer 60 to 90 day window and whether each asset is responding to a different driver.
No. Silver tracks gold while both respond to the same macro forces, but it can break away when its industrial demand story takes over. The link is conditional, not permanent.